Demographics
For developers and investors interested in a district location please contact us. Download the most recent reports on housing, business, community profile, and more.
A statistical portrait of the District, its residents, and businesses.
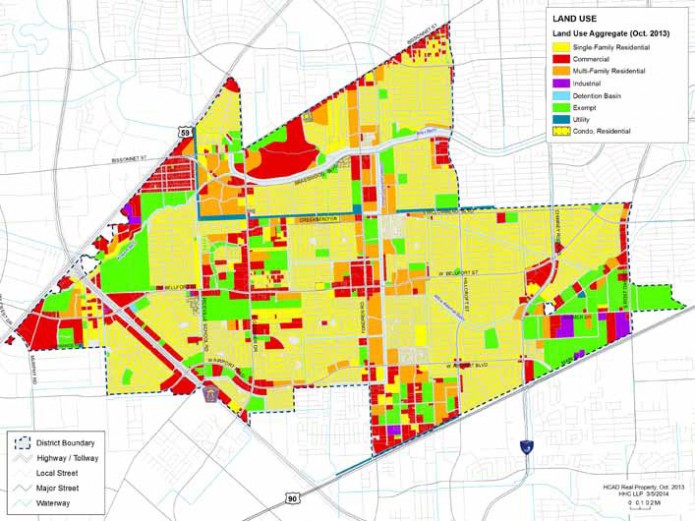
Land Use
As the map demonstrates, District land use varies but is predominantly residential.
Population and Housing Units
The following table reports population, households and housing units for the 2010 census year, 2012 estimated and 2017 projected for the Brays Oaks District compared with City Council District K.
Population, Households & Housing Units (000s) | ||||||
| Source: ESRI | Brays Oaks District | Council District K | ||||
| 2010 | 2012 | 2017 | 2010 | 2012 | 2017 | |
| Population | 96.5 | 98.4 | 104.9 | 196.3 | 202.5 | 219.8 |
| Households | 35.2 | 35.9 | 38.0 | 69.9 | 72.3 | 78.1 |
| Owner Occupied | 15.2 | 15.2 | 16.4 | 37.4 | 37.7 | 41.4 |
| Renter Occupied | 19.9 | 20.7 | 21.6 | 32.5 | 34.6 | 36.7 |
| Vacant Units | 5.7 | 5.5 | 5.4 | 8.1 | 7.9 | 7.7 |
| Total Houston Units | 40.8 | 41.4 | 43.4 | 78.0 | 80.2 | 85.8 |
Projected population growth from 2012 to 2017 is projected to be 6.6% for the Brays Oaks District and 8.5% for District K as a whole, both healthy rates of growth. The higher rate of growth projected for District K is likely due to the relatively larger amount of undeveloped land available for new housing development in the City Council District
Median Age
Median age in the Brays Oaks District for 2012 was 32.6, typical of the Houston area. The median age nationwide is 37.3.
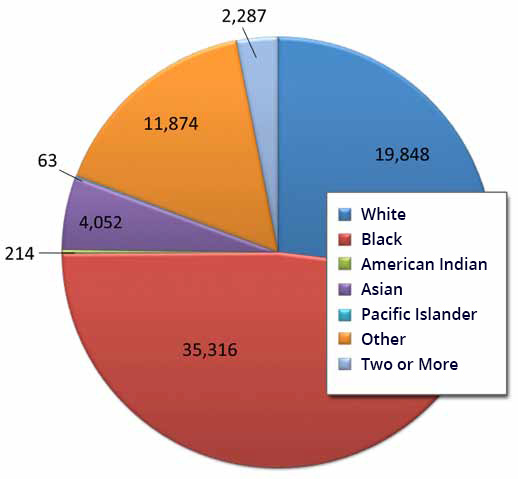
 Race and Ethnicity
 Race and Ethnicity
As is typical for the City of Houston, the District’s population is comprised largely of White, Hispanic and African American segments.
Nearly 6% is now Asian.
Hispanic Origin (Any Race) for 2010 is 33% at 24,307.
Median Household Income
Though somewhat lower than that for the City of Houston as a whole, median household income in the District is projected to grow by 4.15% per year over the 2012-2017 period.
Median Household Income ($000s) | |||||||
| estimated/projected | |||||||
| Brays Oaks | City of Houston | Harris County | 10-Co. MSA | ||||
| 2012 | 2017 | 2012 | 2017 | 2012 | 2017 | 2012 | 2017 |
| $37.8 | $46.3 | $40.5 | $50.4 | $49.8 | $57.1 | $52.7 | $60.3 |
Subdivisions and Home Values
The Brays Oaks District, in many ways, is the best kept secret in Houston. It has 42 middle income subdivisions, many of which were built out in the 70s and early 80s, with well maintained homes and active homeowner associations. However, while the direction of Houston area growth in the 90s and 00s was primarily west, north and in Fort Bend and Brazoria counties, accompanied by sharp increases in existing home values, values in the Brays Oaks subdivisions remained stable. Accordingly, many residential realtors are beginning to realize that Brays Oaks homes may offer outstanding bargains to homebuyers, especially considering the fact that they are nearly all inside the Beltway.
OWNER OCCUPIED HOMES BY VALUE | ||
| Source: U.S. Census, American Community Survey | ||
| Value Range | 2012 Est. | 2017 Proj. |
| Less than $100,000 | 21.1 % | 15.8% |
| $100,000 – $149,999 | 35.1 | 31.6 |
| $150,000 – $199,999 | 23.8 | 28.2 |
| $200,000 – $249,999 | 11.4 | 14.8 |
| $250,000 – $299,999 | 5.2 | 5.9 |
| $300,000 or more | 3.3 | 3.8 |
| Totals | 100.0% | 100.0% |
| Median Value | $141,160 | $154,664 |
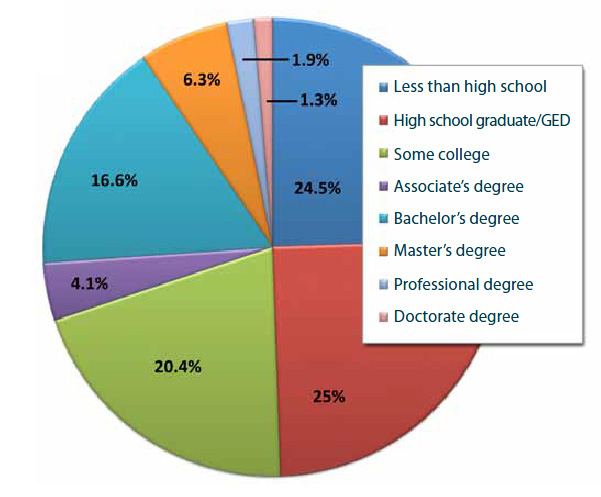
 Educational Attainment
 Educational Attainment
Over one-fourth of District residents 25 years or older have college or graduate level degrees.
Median Value = $127,435
Source: U.S. Census, Community Survey
Occupations of Working Population
The Brays Oaks working population 16 years or older is engaged in a wide variety of pursuits.
Source: U.S. Census, Community Survey
OCCUPATIONS OF EMPLOYED POPULATION | |
| Occupation | Employed – 16+ |
| Managment | 6.8% |
| Business & financial | 3.7 |
| Computer & mathematical | 1.8 |
| Architecture & engineering | 1.7 |
| Life, physical & social sciences | 0.8 |
| Community & social services | 1.3 |
| Legal | 1.5 |
| Education & training | 6.3 |
| Visual & performing arts | 1.1 |
| Healthcare | 7.4 |
| Protective services | 1.6 |
| Food preparation & service | 5.7 |
| Building & grounds maintenance | 7.4 |
| Personal care & services | 3.2 |
| Sales & related | 10.2 |
| Office & administrative | 16.1 |
| Farming | 0.1 |
| Construction & extraction | 10.5 |
| Installation, maintenance and repair | 2.6 |
| Production (industrial) | 3.7 |
| Transportation and material moving | 6.6 |
| Total | 100.0% |
Transportation
As is the case in most areas of Houston, the large majority of District workers drive alone to work. Only 6% use public transportation. However, the District is working with METRO on plans to improve bus service in key Corridors and bring light rail to the South Main Corridor to greatly enhance transit options and travel times and reduce dependence on privately owned vehicles.
MEANS OF TRANSPORATION TO WORK | |
| Method Used | Employed – 16+ |
| Drive alone | 70.4% |
| Carpool | 17.7 |
| Public Transportation | 6.2 |
| Taxi | 0.2 |
| Motorcycle/Bicycle | 0.3 |
| Walk | 1.2 |
| Other Means | 1.1 |
| Work at Home | 2.8 |
| Total | 100.0% |
Retail Expenditures
District households spend nearly $1.5 billion annually for retail goods and services, thereby providing strong support for retail and restaurant businesses in Southwest Houston.
Source: Consumer Expenditure Survey,
Bureau of Labor Statistics


RETAIL GOODS & SERVICES EXPENDITURES ($ MILLIONS) | |
| Products/Services | Amount |
| Apparel and Jewelry | $50.0 |
| Computer Hardware, Software & Accessories | 6.7 |
| Entertainment & Recreation | 90.6 |
| Food at Home | 132.6 |
| Food Away from Home | 96.2 |
| Alcoholic Beverages | 17.3 |
| Nonalcoholic Beverages at Home | 13.1 |
| Financial | 184.1 |
| Health | 17.4 |
| Mortgage Payments & Basics | 240.3 |
| Home Maintenance & Remodeling | 56.4 |
| Home Utilities | 127.2 |
| Household Furnishings & Equipment | 34.8 |
| Household Operations | 26.4 |
| Housekeeping Supplies | 20.1 |
| Insurance | 105.2 |
| Transportation | 239.4 |
| Travel | 37.0 |
| Total | 100.0% |
District Businesses
There are nearly 5,000 businesses with 20,800 employees in the Brays Oaks District. Over half are devoted to services.
BUSINESSES AND EMPLOYEES | ||||
| Source:Dun & Bradstreet | Businesses | Employees | ||
| Business Type | No. | %Total | No. | %Total |
| Agriculture & Mining | 113 | 2.3% | 333 | 1.6% |
| Construction | 329 | 6.8 | 1,213 | 5.8 |
| Manufacturing | 115 | 2.4 | 513 | 2.5 |
| Transportation, Communication & Utilities | 230 | 4.8 | 724 | 3.5 |
| Wholesale Trade | 229 | 4.7 | 853 | 4.1 |
| Retail Trade | 707 | 14.6 | 3,995 | 19.2 |
| Real Estate, Finance & Insurance | 425 | 8.8 | 1,589 | 7.6 |
| Services | 2,662 | 55.2 | 10,675 | 51.3 |
| Government | 15 | 0.3 | 905 | 4.4 |
| Totals | 4,826 | 100.0% | 20,800 | 100.0% |
Esri Business Analyst Reports
You will need Adobe Acrobat Reader to view these files. You can download it for free.
